About GHL Dashboard
The Dashboard is the home page for your GHL device. Here is where you can have your device show as little or as much information as you want. It is also the go-to page for quick access to specific settings within your GHL device.
This article will show you how to customize the look, layout and content of your dashboard.
Before you begin
- If you are not familiar yet with the operating concept of the ProfiLux Controller, we highly recommend to first read the Knowledgebase Article “How the ProfiLux Controller works“. It gives you an understanding of the basics and the operational concept of the controller
Customize your GHL Dashboard
1. Connect to your GHL device to view the dashboard
2. Press the brush icon to the top-right, followed by the (+) icon
3. Select the tiles you wish to add; we recommend Firmware and Switch channels
4. Edit the tiles as needed. When done, press the (√) icon.

Tap here to edit the Dashboard

Tap here to add new tiles

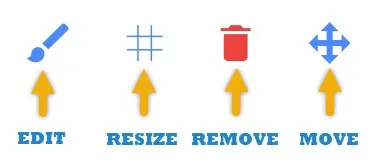
Choose an option to edit a tile
Add / edit content for a specific tile
Certain tiles (Chart, Feed pause, maintenance) allow you to edit the information you see. For example, after adding a chart tile, you must tell your GHL device what data to display.
1. Press the brush icon to the top-right
2. Press the brush icon belonging to the tile you want to edit
3. Select the data to display, press APPLY, press the (√) icon to save changes

Tap here to edit the Dashboard

Tap here to edit a tile
Set your default chart time period
When you add a chart tile to the dashboard or view any chart in-general, we recommend to adjust the default date range for quick viewing to your needs.
To do that, go to the App settings page (3-dots or gear icon) and specify the default period to display.
